Introduction
The post expects the reader to be familiar with generic garbage collection principles built into the JVM. Division of Heap into Eden, Survivor and Tenured/Old spaces, generational hypothesis(假设) and different GC algorithms are beyond the scope of this post.
Difference
Minor GC
Collecting garbage from Young space (consisting of Eden and Survivor spaces) is called a Minor GC.
This definition is both clear(清晰的) and uniformly(统一的) understood. But there are still some interesting take-aways you should be aware of when dealing with Minor Garbage Collection events:
Minor GC is always triggered when JVM is unable to allocate space for a new Object, e.g. the Eden is getting full. So the higher the allocation rate, the more frequently Minor GC is executed.
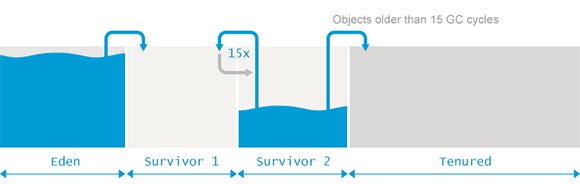
Whenever the pool is filled, its entire content is copied and the pointer can start tracking the free memory from zero again. So instead of(而不是…) classical(传统的) Mark, Sweep and Compact, cleaning Eden and Survivor spaces is carried out with Mark and Copy instead. So, no fragmentation(内存碎片) actually takes place inside Eden or Survivor spaces. The write pointer is always residing on the top of the used pool.
During a Minor GC event, Tenured generation is effectively ignored. References from tenured generation to young generation are considered de facto GC roots. References from young generation to Tenured generation are simply ignored during the markup phase.
Against common belief, all Minor GCs do trigger stop-the-world pauses, stopping the application threads. For most of the applications, the length of the pauses is negligible(微不足道的) latency-wise. This is true if most of the objects in Eden can be considered garbage and are never copied to Survivor/Old spaces. If the opposite is true and most of the newborn objects are not eligible for GC, Minor GC pauses start taking considerably more time.
Minor GC并不意味着不会STW,只是Minor GC会比Full GC开销小。
Major GC vs Full GC
- Major GC is cleaning the Tenured space.
- Full GC is cleaning the entire Heap – both Young and Tenured spaces.
This leads us to the point where instead of worrying whether the GC is called Major or Full GC, you should focus to finding out whether the GC at hand stopped all the application threads or was it able to progress concurrently with the application threads.
This confusion is even built right into the JVM standard tools. What I mean by that is best explained via an example. Lets compare the output of two different tools tracing the GC on a JVM running with Concurrent Mark and Sweep collector (-XX:+UseConcMarkSweepGC)
1 | jstat -gc -t 4235 1s |
1 | Time S0C S1C S0U S1U EC EU OC OU MC MU CCSC CCSU YGC YGCT FGC FGCT GCT |
This snippet is extracted from the first 17 seconds after the JVM was launched.
Based on this information we could conclude that after 12 Minor GC runs two Full GC runs were performed, spanning 50ms in total. You would get the same confirmation via GUI-based tools, such as the jconsole or jvisualvm.
lets look at to the output of the garbage collection logs gathered from the same JVM launch. Apparently -XX:+PrintGCDetails tells us a different and more detailed story:
1 | java -XX:+PrintGCDetails -XX:+UseConcMarkSweepGC eu.plumbr.demo.GarbageProducer |
1 | 3.157: [GC (Allocation Failure) 3.157: [ParNew: 272640K->34048K(306688K), 0.0844702 secs] 272640K->69574K(2063104K), 0.0845560 secs] [Times: user=0.23 sys=0.03, real=0.09 secs] |
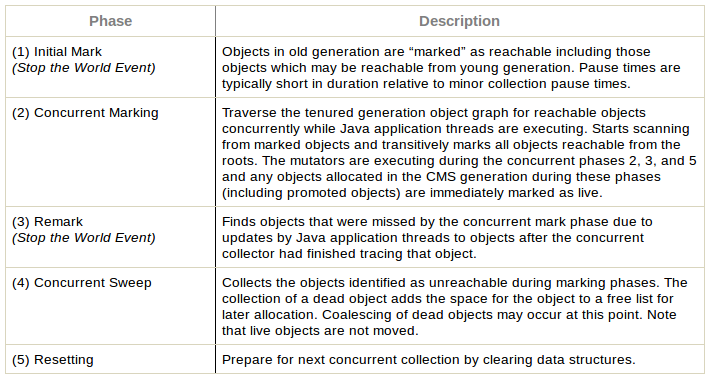
Based on this information we can see that indeed after 12 Minor GC runs “something different” started happening. But instead two Full GC runs, this “different thing” was in reality just a single GC running in Tenured generation consisting of different phases:
- Initial Mark phase, spanning for 0.0041705 seconds or approximately 4ms. This phase is a stop-the-world event stopping all application threads for initial marking.
- Concurrenty executed Markup and Preclean phases. These are run concurrently with the application threads
- Final Remark phase, spanning for 0.0462010 seconds or approximately 46ms. This phase is again stop-the-world event.
- Concurrently executed Sweep operation. As the name states, this phase is also carried out concurrently without stopping the application threads.
So what we see from the actual garbage collection logs is that – instead(而不是) two Full GC operations, just one Major GC cleaning Old space was actually executed.
Pertaining Terms
- S0C:年轻代中第一个survivor(幸存区)的容量 (kb)
- S1C:年轻代中第二个survivor(幸存区)的容量 (kb)
- S0U:年轻代中第一个survivor(幸存区)目前已使用空间 (kb)
- S1U:年轻代中第二个survivor(幸存区)目前已使用空间 (kb)
- EC:年轻代中Eden(伊甸园)的容量 (kb)
- EU:年轻代中Eden(伊甸园)目前已使用空间 (kb)
- OC:Old代的容量 (kb)
- OU:Old代目前已使用空间 (kb)
- PC:Perm(持久代)的容量 (kb)
- PU:Perm(持久代)目前已使用空间 (kb)
- YGC:从应用程序启动到采样时年轻代中gc次数
- YGCT:从应用程序启动到采样时年轻代中gc所用时间(s)
- FGC:从应用程序启动到采样时old代(全gc)gc次数
- FGCT:从应用程序启动到采样时old代(全gc)gc所用时间(s)
- GCT:从应用程序启动到采样时gc用的总时间(s)
- NGCMN:年轻代(young)中初始化(最小)的大小 (kb)
- NGCMX:年轻代(young)的最大容量 (kb)
- NGC:年轻代(young)中当前的容量 (kb)
- OGCMN:old代中初始化(最小)的大小 (kb)
- OGCMX:old代的最大容量 (kb)
- OGC:old代当前新生成的容量 (kb)
- PGCMN:perm代中初始化(最小)的大小 (kb)
- PGCMX:perm代的最大容量 (kb)
- PGC:perm代当前新生成的容量 (kb)
- S0:年轻代中第一个survivor(幸存区)已使用的占当前容量百分比
- S1:年轻代中第二个survivor(幸存区)已使用的占当前容量百分比
- E:年轻代中Eden(伊甸园)已使用的占当前容量百分比
- O:old代已使用的占当前容量百分比
- P:perm代已使用的占当前容量百分比
- S0CMX:年轻代中第一个survivor(幸存区)的最大容量 (kb)
- S1CMX :年轻代中第二个survivor(幸存区)的最大容量 (kb)
- ECMX:年轻代中Eden(伊甸园)的最大容量 (kb)
- DSS:当前需要survivor(幸存区)的容量 (kb)(Eden区已满)
- TT:持有次数限制
- MTT :最大持有次数限制
Reference
https://plumbr.io/blog/garbage-collection/minor-gc-vs-major-gc-vs-full-gc
https://www.cnblogs.com/zhangxiaoguang/p/5792468.html